
Nigel Holmes, in his interviews, spoke about how to fire up people’s imaginations. He explained how he tries to think of different ways to do things that can be sometimes thought of as boring, dull statistics- which is something people often struggle. To make an infographic, one must first understand the data, and what the reader wants. It is still possible to get something out of an ordinary chart, you just need to think a bit beyond. The power of images with statistics is strong. Infographics get people interested in the subject- then they’ll read the numbers.
Holmes has been acknowledged for spearheading "information graphics." This consists of designs that rapidly clarify data. Today, numerous designs clarify nothing. They simply present information, and the peruser is required to work out their implications. When creating an infographic, it is better to take the time to contemplate who the group of onlookers or peruser is, the thing that they've heard or perused regarding the matter, what you can best present face to face, and what you can provide for them to peruse. All things considered, designers sometimes try to overcompensate with graphs, attempting to attract readers with the most ostentatious and complicated designs.
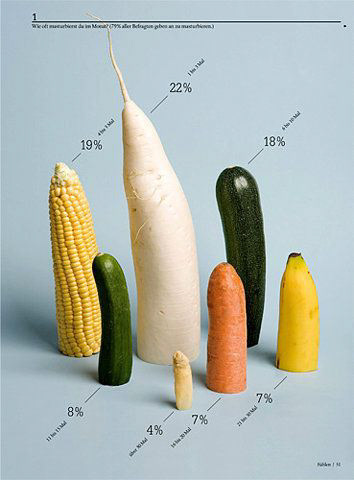
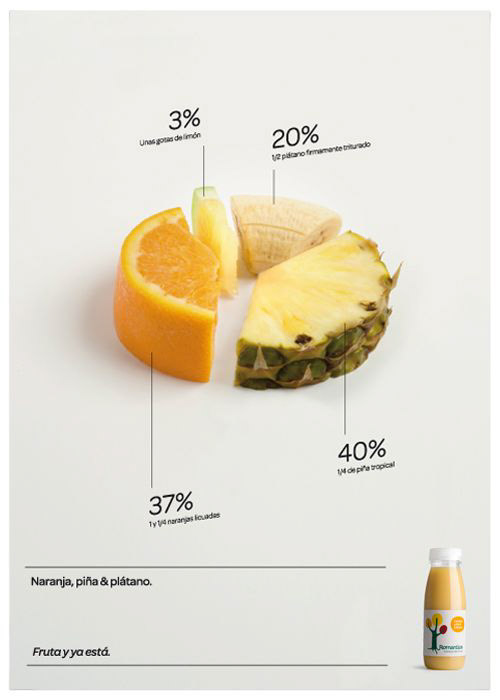
Above: Image Sources: Tumblr.
I just had to share both of these- since they are sort of in the same style- I think they represent Holmes' whimsical but simple style in a way. The dimension of using photographed fruit and vegetables instead of a traditional pie chart or graph brings visual interest- the designer was not taking the data too seriously (or overthinking it)- but found a way to present it without overwhelming readers. Keeping a sense of playfulness, and capitalizing on the most simple elements and letting those represent the data, remains true to Holmes's style.

Above: Image Source: https://www.bloglovin.com/blogs/designspiration-everyone-rss-feed-2547414/mkn-design-michael-nykamp-2652605871
This infographic, as well, mimics Holmes' style quite well. The use of simplified shapes, but keeping texture, simple structure, and monotone color present the data (in this case, how to put together a disposable coffee cup) in a playful but also sophisticated way. The linework of this piece is quite fluid, it flows from the stopper at the top, down and around the lid, down through the steam, through the cup, and into the sleeve. The dotted pattern seems to simplify depth. Overall, this is a marvelously well-executed infographic, and one that does not overcomplicate or render the information boring.
Works Cited
Excerpt from Harvard Management Communication Letter, August, 2002, Interview with Nigel Holmes
http://publishingcourses.stanford.edu/blog/sppc/2007/Holmes_Final_Edit.mp4
https://www.youtube.com/watch?v=zgZfry82LC4