
Nadieh Bremer began an individual venture called Data Sketches with Shirley Wu, another datamaster, where they would each make an infographic around a particular theme each month. Despite the fact that they did it as a fun challenge, the results were well-received. In November 2016, Google News Lab inquired as to whether they might want to have one of their months' projects be a coordinated effort with them. So, Bremer began freelancing, and never looked back.
She likes freelancing because she is entertained the assorted variety of the customers, the information, and the visuals that she gets the chance to make. She frequently makes visuals where it's either straightforwardly about something in space, for example, Figures in the Sky, which analyzes the heavenly bodies of right around 30 unique societies to search for likenesses and contrasts, or where the plan is enlivened by space, for example, Royal Constellations, which uncovers the family tree of all European royalty and resembles a field of stars.
Bremer says the most interesting data set she has worked with is likely one that she utilized for an individual project. Nobody had seen it previously, so she was the primary individual who got the opportunity to delve into that treasure trove of bits of knowledge. She states that on the off chance that you need people to comprehend the information, it should be made visual.
She generally brings the data in question into her most loved data analysis device, R, and cut up it in the manner in which she can work with. When she feels that she has an adequate beginning comprehension of the information, she begins sketching infographic ideas. She states that color is one of the most important visual markers that we use to show information with. As position, shape, scale, and volume are all utilized to depict the information, so is color. She uses color to distinguish diverse data groups, such as countries, or assign certain data groups measurements of value, like temperature.
As Bremer wanted to become more aware of the presence of data representation, she has seen that an ever increasing number of organizations are beginning to understand that just simply sticking data into a boring graph won't grab their viewers' attention, or teach them anything.
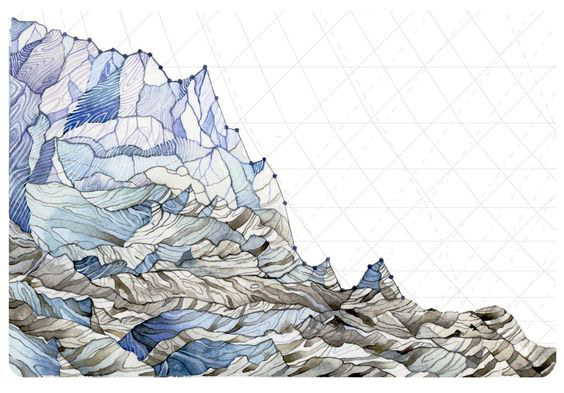
Above: Image Source: https://www.smithsonianmag.com/arts-culture/these-watercolor-paintings-actually-include-climate-change-data-180958374/?no-ist.
This infographic is really interesting because in addition to being dramatically captivating, it serves doubly as a graph and contains real data about climate change. I'm not sure how exactly it is incorporated- the one weak point of this piece is the vagueness (although I suppose that is also the objective- to have viewers see the beauty without the reality!) I found this on Bremer's Pinterest- by the way! She has a lot of different boards on types of infographics, inspiration, color schemes, etc.
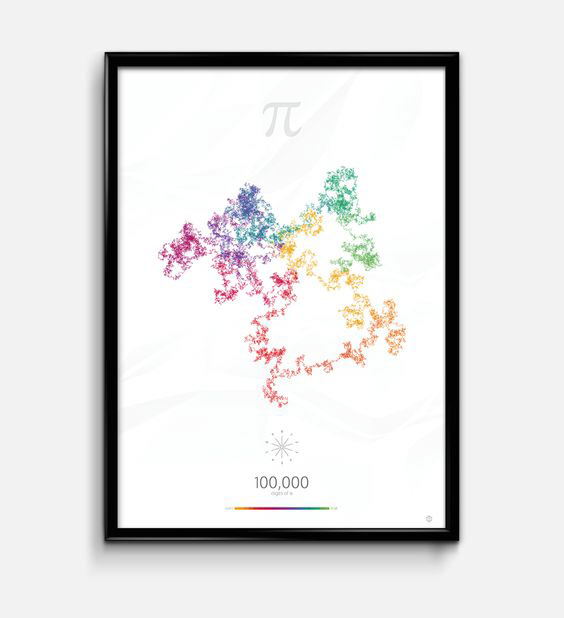
Image Source: https://www.visualcinnamon.com/portfolio/the-art-in-pi
This is actually one of Bremer's pieces! At first glance, I thought it was a map of North America, but it is actually apparently a visual representation of all the digits of pi. I'm not quite sure what the placement and colors (and concentration) of the various plotting points are- but Bremer has seemingly unconventional methods of approaching infographics. She says on her website: "After seeing the examples of Martin Krzywinski’s π art work I wanted to venture into the world of data art myself. My idea of using the digits of π to step into a certain direction certainly isn’t new, but most versions I could find had first converted pi into another base (4 or 16 for example). Therefore, I went ahead with just keeping it in base 10. I plotted and colored the data in R and then imported the PDF into Illustrator to add some text and legends."
Works Cited:
Bremer, Nadieh. “The Art of Data.” Communication Arts, 28 Jan. 2019, www.commarts.com/columns/bremer?utm_source=Communication%2BArts%2BDaily&utm_campaign=f8e4e12a95-RSS_EMAIL_CAMPAIGN&utm_medium=email&utm_term=0_a6a0e887e3-f8e4e12a95-36043273.